• Home
  • Pricing
  • Our Story
  • Blog
  • Contact
  • Instant Reports
  • Log In
  • Pay My Bill
  • Home
  • Pricing
  • Our Story
  • Blog
  • Contact
  • Instant Reports
  • Log In
  • Pay My Bill

Archive for category: Uncategorized

Analysis of the Top 100 Used Car Dealers of 2020

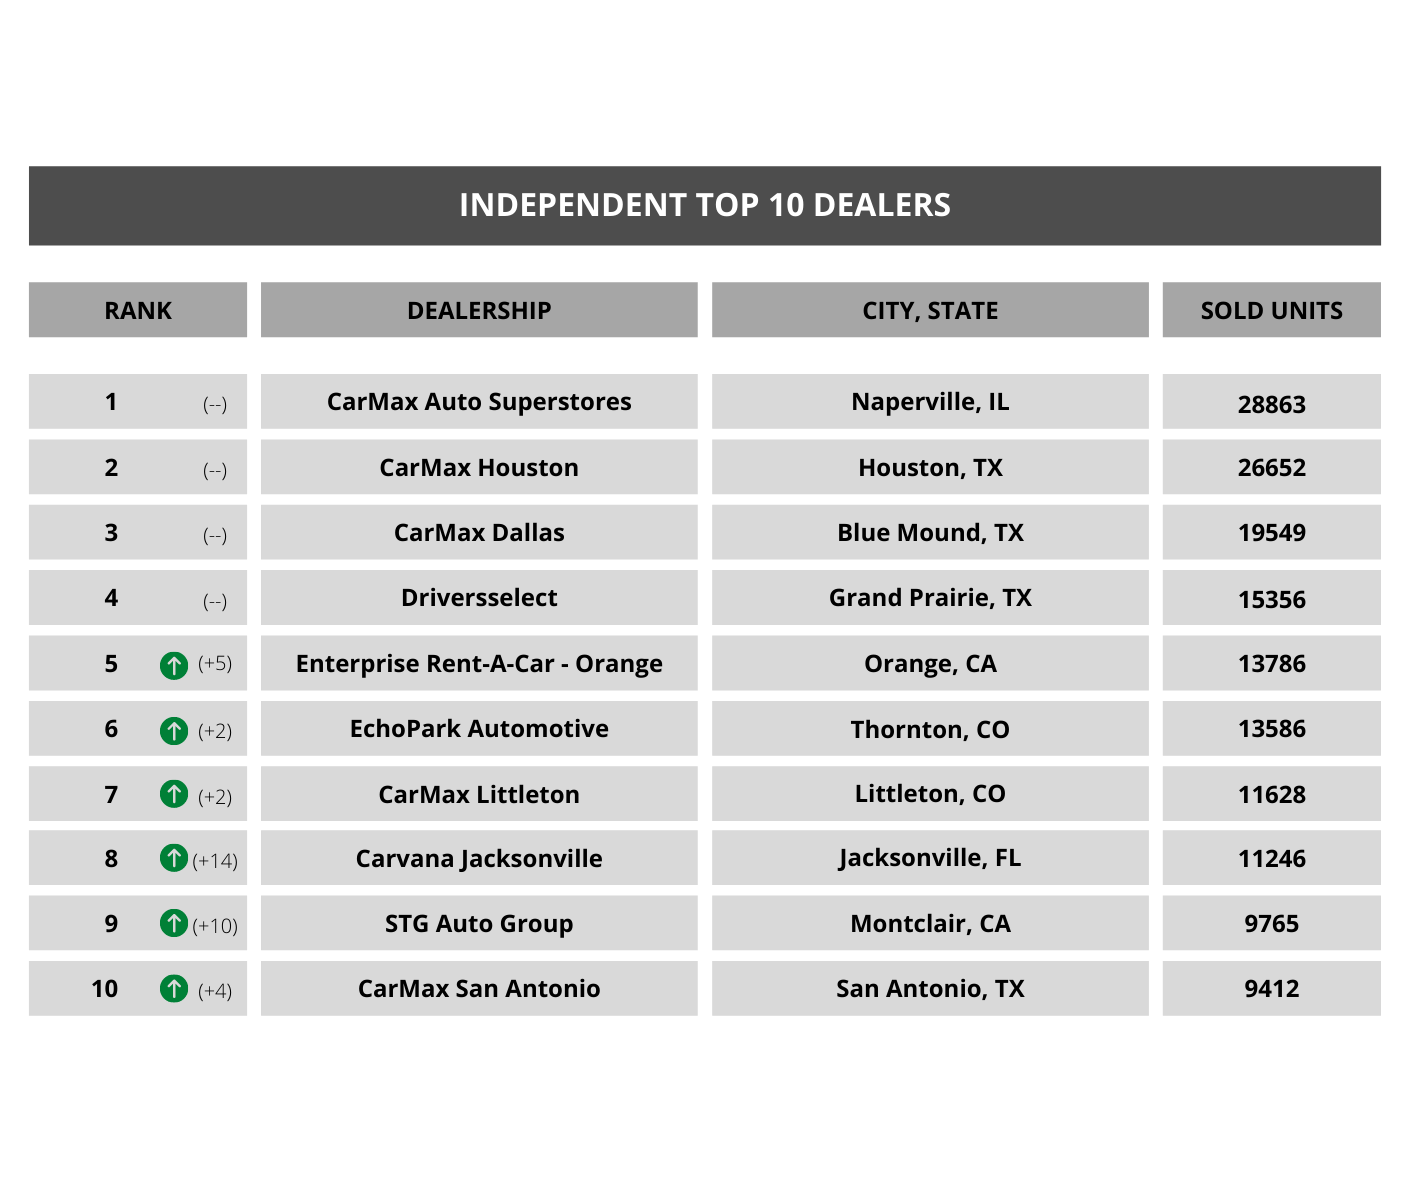
It’s here! Our annual Top 100 Used Car Dealers reports for 2020! The reports are available as a FREE Download and are available to everyone. The reports are a simple ranking of dealerships based on used vehicle sales within their state. But here, we’ve added a little extra data to help tell a story for the top ten dealerships within each category – Franchise and Independent.

May 2020 U.S. auto data suggests v-shape economic recovery

The rain has drastically slowed in the automotive community for the month of May 2020. While year-over-year data suggests that there is still progress to be made, sales in the month of May drastically increased over April 2020. 

U.S. Auto Loses $108 Billion Between March And April 2020

Nearly every car trip results in a transaction or some benefit to our overall quality of life.

COVID-19 Market Impact: Los Angeles

Automotive stakeholders are curious how U.S. auto sales will fare through the coronavirus pandemic.  At Cross-Sell, we took a look at unique markets where the most cases of COVID-19 were reported to see what impact it had on new and used sales. 

COVID-19 Market Impact: Denver

Automotive stakeholders are curious how U.S. auto sales will fare through the coronavirus pandemic.  At Cross-Sell, we took a look at unique markets where the most cases of COVID-19 were reported to see what impact it had on new and used sales. 

COVID-19 Market Impact: New Orleans, LA

Automotive stakeholders are curious how U.S. auto sales will fare through the coronavirus pandemic. At Cross-Sell, we took a look at unique markets where the most cases of COVID-19 were reported to see what impact it had on new car sales.

Interesting Car Sales Numbers 2019 vs 2018

We have some interesting car sales numbers for 2019 vs 2018 from our 23 states to share.

Total Sales in January 2019 – 2,781,437

Total Sales in January 2018 – 2,420,808

That’s a percentage difference of +15%!  Sales are looking good.

[vc_line_chart x_values=”Ford; Chevrolet; Toyota; Honda; Nissan; Jeep; Dodge; GMC;Hyundai;Kia” values=”%5B%7B%22title%22%3A%22Sales%202019%22%2C%22y_values%22%3A%22416213%3B%20374686%3B%20295645%3B%20209179%3B%20193613%3B%20111228%3B%20109823%3B%20101919%3B96901%3B75532%22%2C%22color%22%3A%22blue%22%7D%2C%7B%22title%22%3A%22Sales%202018%22%2C%22y_values%22%3A%22358133%3B%20342186%3B%20251432%3B%20184134%3B%20166526%3B%2099281%3B%2097321%3B%2089103%3B81640%3B61756%22%2C%22color%22%3A%22green%22%7D%5D” animation=”easeOutElastic” css_animation=”bounceIn” title=”New/Used Make Breakdown January 2019/January 2018″]

Let’s take a look at the highest percentage new car make increases for the year.

[vc_line_chart x_values=”Tesla; Ram; Porsche; Land Rover; Acura; Volkswagen; Lincoln; Dodge; Cadillac; Kia” values=”%5B%7B%22title%22%3A%22Percentage%20Increase%22%2C%22y_values%22%3A%22330%3B39%3B31%3B31%3B28%3B23%3B20%3B18%3B16%3B16%22%2C%22color%22%3A%22green%22%7D%5D” animation=”easeOutElastic” css_animation=”none” title=”Top 10 New Automotive Changes 2019 vs 2018″][vc_line_chart x_values=”Tesla;Maserati;Land Rover;Ram;Infiniti;Lexus;Mini;Kia;Nissan;Porsche” values=”%5B%7B%22title%22%3A%22Percentage%20Increase%22%2C%22y_values%22%3A%22117%3B44%3B37%3B35%3B31%3B30%3B28%3B27%3B25%3B22%22%2C%22color%22%3A%22green%22%7D%5D” animation=”easeOutElastic” title=”Top 10 Used Automotive Changes 2019 vs 2018″]

Which car makes are not performing well this year:

[vc_line_chart x_values=”Genesis;Fiat;Chrysler;Maserati;Mini;Mazda;Jaguar;Mercedes-Benz;Buick;Infiniti” values=”%5B%7B%22title%22%3A%22Percentage%20Decrease%22%2C%22y_values%22%3A%2283%3B25%3B22%3B17%3B7%3B4%3B2%3B2%3B2%3B0%22%2C%22color%22%3A%22juicy-pink%22%7D%5D” animation=”easeOutElastic” title=”Top 10 New Car Make Sales Drops 2019 vs 2018″][vc_line_chart x_values=”Plymouth;Oldsmobile;Scion;Pontiac;Saab;Smart;Saturn;Isuzu;” values=”%5B%7B%22title%22%3A%22Percentage%20Decrease%22%2C%22y_values%22%3A%2217%3B17%3B16%3B8%3B7%3B5%3B4%3B3%22%2C%22color%22%3A%22juicy-pink%22%7D%5D” animation=”easeOutElastic” title=”Top Used Car Automotive Sales Drops 2019 vs 2018″]

For more data in an easy to use interactive way, try Cross-Sell Interactive today.  It provides the information you need to stay on top of the competition.  The reports show data in your local market area including: top sellers, makes, models, segments, zips and lienholders.  The data can be exported and used interactively.  Contact us today for a demo.

Sign Up For Cross-Sell Reports