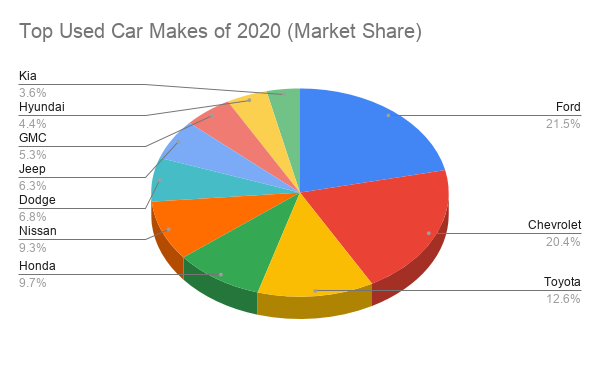
In the face of 2020’s unrivaled challenges, the auto industry stood firm. To determine the industry’s performance despite all odds, the Cross-Sell team ran an analysis on 2020’s full year of used vehicle sales data. We combed the state sales data to isolate the pandemic’s top-performing used car sellers, segments, makes, and models. Here’s what we discovered.
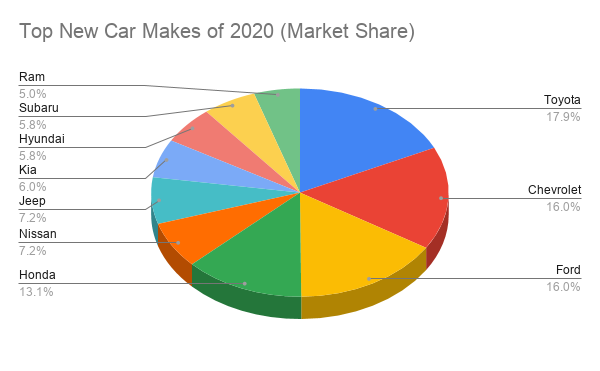
Despite the unprecedented challenges presented throughout 2020, the auto industry rose to the occasion. Our team at Cross-Sell ran an analysis of our database to isolate the pandemic’s top-performing New Sellers, Segments, and Vehicles to close out 2020. Here’s what we discovered.
As with many industries across the United States, the automotive industry has been rocked by COVID. We’re still adapting to all of the changes, but we learn more with each day.
It’s been a wild ride for the automotive industry with the pandemic shutting down dealerships and causing people to stay home and social distance. Due to this, vehicle sales were projected to take a big hit; however, recent data has shown that consumers continued buying cars and kept car dealerships alive. Putting these last few months in the rear-view, let’s take a look at how our industry performed for the first half of 2020.
The recent pandemic has rocked the auto industry, causing vehicle sales to rapidly fall and change the way people shop for cars – focusing on the full online experience. This is where Carvana has a huge advantage. Along with announcing the opening of 100 additional locations across the country, Carvana had a strong advantage during the coronavirus era with already established online purchasing and vehicle delivery processes. We’ll take a look at one major market, Houston, and the impact Carvana has had on that area – both now and before the pandemic arrived.
Automotive stakeholders are curious how U.S. auto sales will fare through the coronavirus pandemic. At Cross-Sell, we took a look at unique markets where the most cases of COVID-19 were reported to see what impact it had on new and used sales.
Fad or not, Carvana has made a major impact in the automotive industry, committing market share robbery from the multitude of used car retailers nationwide.
Genesis has been struggling with sales since 2016 when it was spun off from Hyundai . 2019 sales give no indication of change.

The Genesis is a beautiful car in the Luxury sedan segment topping competitor Porsche in many key satisfaction studies. Genesis topped J.D. Power’s 2018 APEAL study.
These accolades however are not enough to help with US sales in a market that is trending towards SUV’s. Hyundai says they see a long-term strategy on it’s success; but its’ 2019 sales numbers from Cross-Sell’s car registration database of 23 states does not show this.
The G80 is definitely outselling the G90 with 21,003 total sales compared to 5,387 sales. However, it seems the difference in models is declining as shown below:
2016
G80 – 2484
G90 – 339
2017
G80 – 10560
G90 – 2829
2018
G80 – 7488
G90 – 2086
2019
G80 – 471
G90 – 133
For more data in an easy to use interactive way, try Cross-Sell Interactive today. It provides the information you need to stay on top of the competition. The reports show data in your local market area including: top sellers, makes, models, segments, zips and lienholders. The data can be exported and used interactively. Contact us today for a demo.
Vehicle Registration Statistics
Ever wonder how many cars are registered in the United States? What make and model sells the most cars? How many trucks vs cars were sold last year? Cross-Sell Reports track vehicle registration statistics every month from 23 of the 50 states to help dealerships and marketing companies make valuable business decisions. Below are some of the interesting data over the course of the last year 2018 that we offer.

For more data in an easy to use interactive way, try Cross-Sell Interactive today. It provides the information you need to stay on top of the competition. The reports show data in your local market area including: top sellers, makes, models, segments, zips and lienholders. The data can be exported and used interactively. Contact us today for a demo.


![[Infographic] Mid-Year State of the Automotive Market](https://blog.cross-sell.com/hubfs/Imported_Blog_Media/Mid-Year-2020-Infographic_CrossSell_featured-image-01.jpg)
